Since it is not easy to find specific points on this blog I decided last year to show pictures with text on my Facebook timeline. I also started tweeting and discovered that a tweetable text page with one or more pictures is very effective. That greatly increased the readership of the blog. I will use these tweetable pages to show the main points about climate change and required action. There is little room for references on the pictures so I include them at the end of this post. I only recently saw the devastating effects of methane emissions from permafrost and why we have to reach 0 emissions before 2100. The beginning of this post is therefore more elaborate than the rest. I will try to post each picture close to where it is first referred to in the text points A-Z onwards, like 45 in A. If the picture contains data which are covered by another point it will be referred to by number and letter in the first point where it is shown. Following the list of references there are more pictures covering some additional points and newly found information.
 A
A
Under-estimate of global warming and rising sea levels
This is covered under Q of post 30. Picture 45 shows that
previously the IPCC made 7 major points look much better than reported in Paris.
Melting of icefields and methane emissions from permafrost were left out
because the scientists could not agree on figures (1) Q in post 30 also
describes the findings of Dr. Hanson’s team. Only just recently he showed how
warm water currents undermine ice fields. Picture 45 shows that the sea absorbs 93% of all
trapped energy, hence accelerates the melting.
B
The components of greenhouse gas (GHG)
Most of it is water vapour. Some people doubt the
importance of Carbon dioxide (CO2) because up to 95% can be water vapor making
the 5% of CO2 and other gases look insignificant. It is the CO2, methane and a
few other gases that create the water vapour. CO2 is therefore the measurement
of GHG. Methane is 85 times more potent than CO2 but it breaks down fast. Its
20year global warming potential (GWP) is 85 times that of CO2, dropping to 25-
35 in 100 years. It is measured as CO2 equivalent. (4) Since the coming 20 years are critical,
methane emissions should be restricted.
C
Avoidable methane emissions
Emissions from fracking should be avoided and all efforts
should be made to trap cow emissions like Argentina started with fart packs.
They extract about 300 liters of methane a day in backpacks carried by the cows.
According to the EPA, cow farting (and burping, actually a lot of it is
burping) accounts for 5.5 million metric tons of methane per year in the United
States — that's 20 percent of total US methane emissions (6) Collecting the
methane from all waste will be required. Livestock emissions make up anywhere
between 14.5 and 18 percent of total global greenhouse gas emissions. (7). One
tonne of nitrous oxide is equivalent to 298 tonnes of carbon dioxide. (8) Cow
manure emissions also contain nitrous oxide. (9).
D
Methane emissions from melting permafrost
These can be diminished by sticking to our 0 emission,
limiting global warming to 1.5 degrees
 The story behind Picture 42 is that scientists
used aerial sampling of the atmosphere to locate methane sources from
permafrost along a 10,000 square-kilometer swath of the Mackenzie River Delta
in northwestern Canada. Deeply thawed pockets of permafrost, the research
suggests, are releasing 17 percent of all the methane measured in the region,
even though the emissions hotspots only make up 1 percent of the surface area. In
those areas, the peak concentrations of methane emissions were found to be 13
times higher than levels usually caused by bacterial decomposition. This would
confirm that the gas has been buried deep beneath Arctic permafrost for
millennia. Some of that gas appears to
be finding new paths to the surface through permafrost that starts to resemble
Swiss cheese (15)
The story behind Picture 42 is that scientists
used aerial sampling of the atmosphere to locate methane sources from
permafrost along a 10,000 square-kilometer swath of the Mackenzie River Delta
in northwestern Canada. Deeply thawed pockets of permafrost, the research
suggests, are releasing 17 percent of all the methane measured in the region,
even though the emissions hotspots only make up 1 percent of the surface area. In
those areas, the peak concentrations of methane emissions were found to be 13
times higher than levels usually caused by bacterial decomposition. This would
confirm that the gas has been buried deep beneath Arctic permafrost for
millennia. Some of that gas appears to
be finding new paths to the surface through permafrost that starts to resemble
Swiss cheese (15)Arctic and sub-Arctic marine sediments are thought to host vast reservoirs of methane stored in methane hydrate. (5) Near Norway over 250 plumes of gas have been discovered bubbling up from the sea floor to the west of the Svalbard archipelago. They are created by the West Spitsbergen current, which has warmed by 1 °C over the past 30 years. The entire hydrate deposit around Svalbard could be releasing 20 mega tonnes a year. It does not reach the surface yet but could, if larger bursts occur. (10). Another article explains how large reservoirs of methane formed underneath the Barents sea when it was still ice. Following melting, pressure from the gas lifted the seafloor to create the giant mounds. During small leaks microbes in the water use up the methane before it reaches the atmosphere but larger burbs are possible (11) In 2007, air monitors detected a rise in methane concentrations in the atmosphere, apparently from far northern sources. Russian researchers in Siberia expressed alarm, warning of a potential surge in the powerful greenhouse gas, additional warming of several degrees, and unpredictable consequences for Earth's climate (13) In Siberia Zimov is out to prove that recreating the ancient Arctic ecosystem could be a viable way to halt the threat of permafrost. In a movie he shows that by poking holes in the snow you can ignite the methane, reducing the global warming potential (GWP) from 85 to 1. The movie also shows inspection tunnels in the Siberian permafrost and one of the biggest methane craters (18) Such craters are the result of large mounds described above, exploding, which can happen again. Researchers have discovered hundreds of huge craters, with many over 3,000 feet wide, on the seafloor of the Arctic Ocean. The craters in the Barents Sea, north of Norway and Russia, formed through huge mounds full of methane exploding suddenly and catastrophically around 12,000 years ago, and are still leaking methane. (23)
E
Global warming caused by fluorocarbons
The CO2 equivalent includes fluorocarbons, which are 1000
times more potent than CO2. They are also responsible for ozone reduction which
increases sun radiation at the pole. This is well recognized and scientists
work hard at curbing their levels in the atmosphere. The ozone-destroying
chlorofluorocarbons (CFCs), have now been widely banned under the Montreal
Protocol, but the two other main types also present environmental problems. Neutralizing
fluorocarbons has required a process whose high temperature drives up its cost.
Researchers at Brandeis University used a silyium-carborane catalyst to break
carbon-fluorine bonds at room temperature. This promises to make it easier and
more effective to dispose of pollutants. The strength of the fluorine-carbon
bond makes fluorocarbons valuable in chemically resistant and durable materials
such as stain repellants, non-stick cookware, and coolants. (14)
F
Rising CO2 levels and effect on temperature
During the previous 3 ice ages the CO2 levels went up and
down between 180 and 290 ppm, now we are above 400 ppm Only 2% is caused by
forest fires and volcanic action, the rest is caused by humans mainly during
the last 50 years. In 2015 we added a record 3.05 ppm. (2)
Global warming is determined by 4 organizations which
take daily temperature readings of thousands locations on land and in the sea.
Each is compared to the 30 year average at the specific time of the day. The
global warming Is shown as averages obtained by each of the 4 organizations and
the graphs show that there is little difference between the 4 organizations. (18)
There are 2 parts less steep than the others. They are referred to as mini ice
ages due to the influence of the sun. That influence is debatable. One graph
shows the sun activities going up and down regularly without significant
spikes. It appears that variable CO2 emissions are the cause. One article shows that 2017 was at 1 degree the
hottest year without an el nino effect. 2016 which had an el nino rose to a
peak of 1.3 degrees. The 1998 el nino
peak was 0.9 degrees. That 0.4-degree rise is common for all temperatures
during the last 18 years according to their graph (19)
G
The case of 0 emission earlier than 2100
The graph in Picture 42 D
suggests that, according to the IEA we will reach the important 2 degrees before
2040 unless we take drastic action. As shown in F) above we had .04 degrees
global warming during the last 18 years. That is .02222 degrees per year.
Provided methane emissions remain the same it would raise el nino peaks like
the present 1.3 to 2 degrees in 2048. Another source (10) explains that the
projections for 2100 are based on the 100 years life of methane while the 20
year figure of 85 times potency over CO2 should apply. Their warning is: “The
world really needs to worry that we are likely to cross dangerous tipping
points long before then, including the irreversible loss of enough ice on
Greenland and Antarctica to raise sea levels perhaps 40 feet or more”. In Q of
post 30 Dr. Hanson explained that during the previous ice age, sea levels rose
9 metres under similar temperature conditions. That could be the 3.6-5.3
degrees shown by the IEA. You can see their point. Such fast 0 reductions seem
impossible. Fortunately, scientist and industries are working on many
technologies other than renewables.
H
Required action to reduce emissions
In June 2016 the G7 nations signed an agreement to try to
come to 0 emissions by 2100 in order to limit global warming to 2 degrees. As
shown above, 2050 is a better target. In Paris some 195 countries submitted
plans on how they would reduce emissions. For most it covered the first 30
years. More drastic reductions are required to reach the 2 degree target.
I
Progress made since Paris

Progress has been made in renewable energy from wind and solar but far more needs to be done. The action trackers on picture 40 shows that present anticipated emissions will result in 3.3-3.9 degrees warming while the committed national determined contributions will require a drop of 40 Gigatonnes of CO2 equivalent and will result in 2.5-2.8 degrees warming. O emissions will result in 1.5 degrees but requires another 30 Gt drop beyond the Paris commitments. Canada and the US have identical Copenhagen agreements, which can’t be met. Both extended the same trend to reach the Paris commitment. The US is doing better than Canada but both countries have to use CCU and hydrogen power to come even close to their commitments. China had in the past a steep increase and agreed to level off. It is expected to achieve it by spending a lot on climate action as shown in picture 45 A. India knew that it could not yet level off and exceed their commitment. There are many stories of phenomenal growth in wind and solar power, so that may be the reason.
Carbon capture is essential
 Picture
21 shows that the IEA counts on 31% carbon capture to reach 0 emission.
The IPCC has done a series of studies over the years determining how CCS
improves flexibility and how it can reduce the over-all cost of mitigation. The
latest version I saw is 2005. At that time, they found that 15-55% CCS was
required for world-wide mitigation. It includes storage cost but none of the
money which can be made by utilizing the captured CO2
Picture
21 shows that the IEA counts on 31% carbon capture to reach 0 emission.
The IPCC has done a series of studies over the years determining how CCS
improves flexibility and how it can reduce the over-all cost of mitigation. The
latest version I saw is 2005. At that time, they found that 15-55% CCS was
required for world-wide mitigation. It includes storage cost but none of the
money which can be made by utilizing the captured CO2
K
Recycling of carbon captured from the air.

Reforestation is one way to take more carbon out of the atmosphere. It takes a long time and when we let it rot away it releases the CO2. When used to generate heat or power it is therefore a carbon neutral biomass. Algae grown in lagoons grow much faster than forests and can easier be processed into biomass. Picture 6 shows that production of carbon neutral jet fuel is quite feasible but costs more than regular fuel. Algae yield 10-100 times more fuel than other crops, requires little water and require only 0.42% of all US land to produce all the petroleum fuel in the US. There are at least 3 plants in operation that capture CO2 from the air. Climeworks in Switzerland has been praised as the first operating plant. The CO2 sells for $400 per tonne, feeding greenhouses. An earlier article (24) gives a review of 3 plants and states that Climeworks captured CO2 is sold to make diesel fuel. Picture 25 shows the huge Carbon Engineering plant in Squamish BC, Canada. Because it has not yet been in commercial operation it is classified as a pilot plant. It will produce carbon neutral fuel.

L
L
M
New technologies
for carbon capture and utilization
Picture
25 K shows 3 different technologies to capture from stack emissions, one
from India and 2 from Canada. All have been proven to work and are patented so lots
of money can be made by propagating this equipment around the world.
Profitability depends largely on what customers are prepared to pay for the captured
CO2 but all 3 show much lower capture cost than the amine process. Power consumption for post combustion capture
is about 30% and a major cost problem. The exception is CO2 solutions, picture 25 K. CO2
Solutions’ technology solves these challenges by employing the most powerful
known catalyst for carbon management, the enzyme carbonic anhydrase (27)
Picture
33 shows that the Canadian company Carboncure can improve concrete and save
cement by using captured CO2, which is one example of utilization. Others are
production of ethanol,
fertilizers and plastics. Capturing of CO2 from gas
wells has proven to be rather cheap. Now I see that the cost of CO2 for the
large food and beverage market is coming down. Union Engineering reduced their
cost 30% to $ 23 per ton via the Flash CO2 process. It is a refinery process High
purity liquid CO2 ( >99,99%) is recovered from the bottom of the CO2
distillation column its pressure can be increased to the required pressure for
EOR, Urea or methanol production. Depending on the feed gas quality it might
also be partly used as food grade quality. (25,26).
PS 6 July 30 2018
CarbonCure is expanding its business rapidly and has
acquired yet another supplier for their CO2
CarbonCure’s technology injects carbon dioxide (CO₂)
sourced from the refineries of industrial emitters into concrete, where the CO₂
becomes mineralized, thereby enhancing the strength of the concrete. The
innovative solution helps concrete producers to lower production costs and make
a meaningful contribution toward the global effort to reduce atmospheric CO₂
emissions. Airgas offers concrete producers a complete value-added CO₂ supply
and service solution, supported by its large and reliable Gulf Coast
distribution network.
CarbonCure is the world leader in a breakthrough market
known as CO₂ utilization, with nearly 100 installations of its technology
across North America. The Global CO2
Initiative estimates that CO2 utilization in the concrete sector alone
represents a $400 billion market opportunity.

I had the impression that Aemetis mentioned in picture 33 uses post combustion capture with similar enzymes as CO2 Solutions. They don’t but produce ethanol from organic waste The Aemetis integrated demonstration unit was built to showcase high yield cellulosic ethanol production through the integration of advanced gasification from InEnTec with patented microbial fermentation from LanzaTech,”(28) Aemetis has also entered into an agreement with Denmark-based Union Engineering to design and construct a 300 ton per day capacity liquefied carbon dioxide facility.”(29). That is a completely different process used in refineries and petrochemical plants. Steam Methane Reformers, with CO2 recovery can generate higher H2 yield and CH4/CO fuel gas at the same time as it offers a high CO2 concentration source that can be recovered at a reasonable cost. (26)
N
Market for captured CO2
The variation is staggering. Source and quality play a
major role. Here are a number of quotes:
1
In the US pipeline system, the cost of CO2 for EOR can
vary from $15 per tonne to $ 45 per tonne. The latter applied when oil prices
were $100 per barrel. The $ 15 is the cost for compression and transport and
will apply when more CO2 is captured than needed for EOR (30)
2
The text in picture 25 K shows that In India, Carbon Clean Solutions
operates at $30 per tonne. This is confirmed by the recent merger with Veolia
(31). Their own website shows $40 per tonne (32) The 600,000 tonnes per year is
a misquote It is 60,000 tpy. Their website has a counter. From 2009 till 25 Jan
2017 they captured 319,039 tonnes. Considering that it captures from a coal
fired plant it is quite encouraging.
3
Inventys, the Canadian company in picture 25 K will build it’s first plant in
Saskatchewan and based on many test runs the cost is expected to be below $30
per tonne (33)
4
CO2 solutions, the other Canadian Company in picture 25 K has 2
partially funded projects, one for 30 tonnes per day and another for 300 tons
per day. “At large scale, technology delivers costs of $25 to $35 per tonne of
CO2captured”. They are also aiming at the high priced soft drink market with 10
tpd plants like the proposed 10 tpd carbon capture unit at a “Caribbean
beverage bottling plant •Will supply CO2captured from local boiler for
carbonation of soft drinks”. (34)
5
Union Engineering’s Flash CO2 process will deliver liquid
CO2 at $23 per tonne and some of it will be food and beverage quality. It also
produces hydrogen but not green hydrogen obtained from electrolysis. (25 26)
6
Aemetis, which will produce CO2 for the Keyes ethanol
plant shown in picture 33
M is quite clear about the price for the food and beverage industry “Right
now, the end user price of pure CO2 is about 8 cents per pound ($160 per ton).
The Keyes plant would likely about 180,000 tons of CO2 per year, with peaks and
valleys in CO2 production level based upon the fermentation cycle, and the CO2
plant would convert 110,000 tons (the consistent, base production level from
fermentation) into liquid CO2.’ (29) No wonder they asked Union Engineering in
N5 above to join them and use their $30 per ton expertise as well.
7
The strangest price variants occur in capturing CO2 from
the air. Climeworks in Switzerland does it for $ 400 per tonne feeding
greenhouses (35) Eisenberger’s $24 million demonstration plant
struck deals to supply at least one customer with carbon dioxide harvested from the sky. He claims it can be done for far less than $100 and points out that the future is in using CO2 and hydrogen to produce carbon neutral fuels(36) That is exactly what Carbon Engineering is doing at their Squamish BC plant (picture 25 K). They expect it will cost between US$1 and $1.50 a litre. (36) They started their equipment, produced a small quantity of liquid fuel and will soon synthesize 1 barrel per day. (37)
struck deals to supply at least one customer with carbon dioxide harvested from the sky. He claims it can be done for far less than $100 and points out that the future is in using CO2 and hydrogen to produce carbon neutral fuels(36) That is exactly what Carbon Engineering is doing at their Squamish BC plant (picture 25 K). They expect it will cost between US$1 and $1.50 a litre. (36) They started their equipment, produced a small quantity of liquid fuel and will soon synthesize 1 barrel per day. (37)
O
General aspects of hydrogen power generation
Picture 32 shows that without CCU and hydrogen power
generation Canada will be unable to meet its Paris commitment. Green hydrogen
can be produced in large quantities from renew
able power using electrolysers to split water in hydrogen and oxygen. (38, 39). The hydrogen can be used as replacement of natural gas in existing power plants using gas turbines or in hydrogen fuel cell power plants operating presently on hydrogen obtained from fossil fuel. Hydrogen is already being used in large quantities to power cars, trucks and trains while development for ships is underway. If it is all green hydrogen we have a chance to meet our Paris commitments
able power using electrolysers to split water in hydrogen and oxygen. (38, 39). The hydrogen can be used as replacement of natural gas in existing power plants using gas turbines or in hydrogen fuel cell power plants operating presently on hydrogen obtained from fossil fuel. Hydrogen is already being used in large quantities to power cars, trucks and trains while development for ships is underway. If it is all green hydrogen we have a chance to meet our Paris commitments
Green hydrogen can also be generated from biofuel. Aemetis
referred to in N6 for CO2 production, produces hydrogen at reasonable costs with
the same cellulose fermentation process for all types of waste (40). The
Fountain Valley station in California uses municipal sewage to produce hydrogen
for hydrogen fuel cell vehicles (FCVs) (41) In Fukuoka, Japan, Toyota is converting human waste into hydrogen to
fuel the Mirai.(42) Toyota also hopes to complete by 2020 a manure plant in Los
Angeles that provides electricity for around 2350 homes and hydrogen for 1500
vehicles.(43)
P
270 000 tpy of green hydrogen for the Netherlands

Picture 49 did not copy too well but shows that the plan is to produce 160 000 tpy of green hydrogen using wind power by 2030. The Netherlands has vast shale gas reserves but are concer
ned about the earthquake danger, hence the push for green hydrogen. It includes 100 000 tpy hydrogen from biogas. Most of it will be used to feed Dutch and German pipelines, produce ammonia and methanol. The hard to read transportation allotments in thousand tpy are 100 000 cars (12) 1300 buses (10) 50 trains (5) The hard to read utilisation categories are: Distribution of energy throughout regions, buffer to increase system reliance, decarbonize transport and industry energy use, serves as feedstock using captured carbon and helps decarbonizing heat for buildings.
Apart from the references in O above there is an
excellent article by professor van Wijk, showing many more details (44). It
includes the following statement: The total investments for the development of
a green hydrogen economy in the Northern Netherlands up to the year 2030 are
estimated to be between 17.5 and 25 billion euros.
Q
Canadian progress by Hydrogenics
Picture 39 sums up the fame of this company. Most
references are in various post of the blog and some new ones will be shown
below. Picture 20
shows their first wind gas plant in Germany and the first Alstom train equipped
with heir fuel cell technology. After careful evaluation of competitors they
won an agreement, valued at over €50 million It includes the supply of at least
200 engine systems along with service and maintenance as necessary over a 10
year period. Picture 20
also mentions Hydrogenics involvement with Korean power plants. Details can be
found in reference 45 below. Not yet documented on the blog is that Hydrogenics
has partnered with Enbridge to pr
ovide a 2 MW storage facility in Ontario (46). This is not a windgas plant. The electricity comes from the net and the system is described as a Power-to-Gas project. Also not yet documented is that Hydrogenics won the contract for a second windgas plant in Germany (47) and another one for Palm Springs in the USA (48)
ovide a 2 MW storage facility in Ontario (46). This is not a windgas plant. The electricity comes from the net and the system is described as a Power-to-Gas project. Also not yet documented is that Hydrogenics won the contract for a second windgas plant in Germany (47) and another one for Palm Springs in the USA (48)

Hydrogenics is also in the automobile business. It has
signed separate supply agreements with several Chinese electric vehicle
integrators to bring its fuel cell and fueling station technology to China. Hydrogenics
has worked closely with a number of Chinese companies throughout
the past year – already delivering over 30 propulsion systems
 for buses and other vehicle
platforms from leading original equipment manufacturers (OEMs) such as Futian
and Volvo. The largest bus OEM in China, Yutong, is one of the key suppliers
seeking to bring fuel cell technology into the urban transit mainstream. The
deals signed Friday cover more than 2,000 vehicles over the course of the next
3-5 years. (49)
for buses and other vehicle
platforms from leading original equipment manufacturers (OEMs) such as Futian
and Volvo. The largest bus OEM in China, Yutong, is one of the key suppliers
seeking to bring fuel cell technology into the urban transit mainstream. The
deals signed Friday cover more than 2,000 vehicles over the course of the next
3-5 years. (49)
the past year – already delivering over 30 propulsion systems

R
As documented in post 30 this Canadian company sold its car expertise to Volkswagen and went in partnership with a Chinese company to supply and maintain its fuel cells for 10 000 trucks and buses. Some buses are shown in picture 20 Q Not yet documented is that they do very versatile work for other countries . In January 2017 Ballard FCveloCity® engines were powering more than 80 buses around the globe: 41 in Europe, including Belgium, Germany, Italy, the Netherlands, Norway, Scotland and the U.K.; 24 in the Cities of Foshan and Yunfu, China; 13 in the U.S.A., including the states of California, Massachusetts, Michigan and Ohio; 3 in Brazil; and 1 in India. During the last 10 years Ballard has worked with 13 bus manufacturers to develop a variety of fuel cell bus configurations that have been deployed in a wide range of climatic conditions and operated under a host of demanding duty cycles. (50)
There are a number of other companies using fuel cells
for hydrogen vehicles. Ballard has developed the necessary technology building
blocks for automotive fuel cell stacks, including world leading designs and
capabilities relating to anode and cathode catalysts, membrane electrode
assemblies, bi-polar plates (including flexible graphite, molded carbon and
metal plates), the elimination of cell voltage monitoring, and the use of
advanced modeling tools to predict stack performance. (51)
PS 5 July 30 2018
Further news from Hydrogenics shows that important
contracts have been signed or underway. Apart from Ballard Hydrogenics will
also become a major contributor to the Chinese hydrogen bus and truck fleet. I
paste some abstracts below and hope that Canadians look at these developments instead
of concentrating on oil alone. Another one is CCU where new development is
shown in PS 6 under point M
“Jan 29, 2015 - In 2014, Hydrogenics secured contracts
for nine Hydrogen fueling ... over 10 fueling stations in California and more
than 50 stations worldwide”
“The 2.5-megawatt
Zero Impact Production (ZIP) hydrogen facility in Palm Springs, California will
use Hydrogenics’ state-of-the-art PEM electrolysers to convert wind and solar
energy into 1,000 kilograms of renewable hydrogen per day.” The hydrogen will
be used to charge cars. In 2016 6 different models were available consuming on
average 1 kg of hydrogen per 100 km.. For short 50 km commuting trips that
would get 2000 fossil fuel cars off the road.
It is only 0.4% of what Hydrogenics 25 MW units will have to produce in
the Netherlands from wind and 4% of their solar generation (picture 49)
By Joanna Sampson5 December 2017
SinoHytec and its partners, including Foton, are
promoting a fleet of 150 fuel cell buses in Zhangjiakou, where China will be
hosting the 2022 Winter Olympic Games. The completion and delivery of this
fleet is expected in early 2018. Trudeau had the opportunity to learn more
about how Hydrogenics and SinoHytec are working together to jointly address
climate change by reducing the carbon footprint related to transportation in
China.
“Hydrogenics has the leading technology for providing
zero-emission transit solutions to the public. We are currently completing the
largest operating hydrogen fuel cell bus fleet on the planet, and we look
forward to a very successful and long-term collaboration with Hydrogenics,”
explained Zhang
S
Declining oil demand due to EVs and FCEVs
Bloomberg’s announcement in picture 44 shows a fast increase in EVs. Further
details are: “Bloomberg New Energy Finance (BNEF) forecasts EVs will be as
cheap as gasoline cars by 2025 and keep dropping in price until EVs overtake
them in yearly sales, by which time EVs will be displacing 8 million barrels of
oil a day — more than Saudi Arabia exports today”.
 In addition, a whole article
complete with graphs and tables shows the most likely scenario including that
the 8mbpd will be reached in 2040. (52) Since the projection does not include
hydrogen vehicles it may occur before that date
In addition, a whole article
complete with graphs and tables shows the most likely scenario including that
the 8mbpd will be reached in 2040. (52) Since the projection does not include
hydrogen vehicles it may occur before that date
Problems with CCS from stack emissions
Another great help is that sales of fossil fuel vehicles
will be banned. The most aggressive pronouncements are:
“India is targeting all vehicles on the road to be
powered by clean energy by 2030. In Norway, over 20% of new vehicles sold today
are electric and the government wants 100% of sales to be zero-emission by
2025. The Netherlands is also following suit. Germany is reviewing a similar
objective. Early indications suggest that over 800,000 new energy vehicles (NEVs, which includes BEVs and FCEVs) were
produced in China in 2017. The Chinese government has set a goal of 2 million
NEVs produced annually by 2020” (51)
In 2017, we also saw unprecedented developments at the
city level when 12 of the C40 cities – including London, Paris, Los Angeles,
Copenhagen, Barcelona, Vancouver, Mexico City, Milan, and Seattle – signed the
“C40 Fossil-Fuel-Free Streets Declaration” – establishing a target of procuring
only zero-emission transit buses by the year 2025. Over the next few years, we
expect more countries and cities to set up plans to ban ICE-based vehicles.
(51)
T
Declining costs of wind and solar power
References not included in picture 49 P show a windfarm in Morocco, where
Enel Green Power will produce unsubsidized wind power for 3c/kwh. I checked several
websites and it is a great development. It involves 5 wind farms with a total
capacity of 850 MW (53). The other reference shows a large solar panel field in
Dubai where Masdar Consortium will supply unsubsidized solar power for 3c/kwh. Again, there are
several articles about that project. DEWA has adopted the Independent Power
Producer (IPP) model to build the 800MW third phase of the Mohammed bin Rashid
Al Maktoum Solar Park. It has generated international interest from global
business and energy companies (54)
Picture
47 describes how Alberta reached their 20 year contract using
3 companies to supply wind power at 3.7c/kwh. It requires $10 million per year
in subsidies but that still makes it a good deal. The 3 farms have a total
capacity of 564 MW. At a capacity factor of .3 they will produce
.3x564x24x365=1482 MWH/year. At $10 million per year the subsidy will be
10/1.482= $6.75 per MWH, say 0.7 c/kwh. Hence the total cost for those 20 years
will be 3.7+0.7= 4.4c/kwh
As noted, BC has
better wind conditions than Alberta and could get an even better deal rather
than spending 8.7c/kwh for site C.


Based on data documented in neilwilhees.blogspot.ca a newspaper accepted my 400 word comment about
7 alternatives for the KM pipeline : http://www.nsnews.com/opinion/letters/letter-rail-beats-pipelines-for-safer-transport-of-alberta-oil-1.2365559
It shows that three will transport unsinkable oil while the 4 others avoid all
tanker traffic through BC waters. Two of the fully estimated proposals are for
refineries which would export finished products from Kitimat refineries and
will be among the very few that will capture and utilize the CO2 emissions they
create. The third is a huge pipeline which will carry unsinkable syncrude and
export it by tanker via Prince Rupert. The Asian super refineries can easily
handle dilbit, which is a sour heavy crude. Syncrude and other similar light
sweet oils are more expensive but seem essential to diminish the tanker
controversy in BC waters. The oil fields have 9 upgraders. Shell, Suncor and
Syncrude produce the most (58) Until recently 45% of our bitumen (1.33 bbpd)
was upgraded (49).

In 1982
the Canadian Constitution was amended by adding section 35 giving First Nations
far more say in development of projects. First Nations have now much better
access to money for their projects. RBC completed a C$545 million bond issue
for the Fort McKay and Mikisew Cree bands - the largest ever private investment
by a First Nation - allowing them to buy a 49 per cent stake in a Suncor Energy
SU.TO 1.65% storage facility. "The deal was oversubscribed," It's
assets that create cash flow," said Joe Dion, Chief Executive of First
Nations-owned Frog Lake Energy Resources Corp, which produces 2,000 barrels of
oil per day. "We get a piece of the action." Investment bank AltaCorp
Capital is raising funds for a $16 billion oil pipeline, proposed to run from
Alberta to the northern British Columbia coast. The project has modest
financial backing from one of Canada's richest families, the Aquilini Group,
and support from 35 First Nations to use their land. In exchange for allowing
that access, the bands will own at least 35 percent of the pipeline and a
corresponding share of the profits. Major Canadian oil producers including
Suncor Energy Inc., Cenovus Energy Inc. and Meg Energy Corp. also want it to go
ahead, while investment broker AltaCorp Capital Inc. has been lined up to
organize financing. The pipeline’s right of way would be on an energy corridor
that would be pre-approved by First Nations to also house gas pipelines, hydro
lines and fiber optic cable. That Eagle Spirit pipeline can carry twice the KM
volume. Even though no dilbit will be shipped they are subject to the tanker
moratorium and have a memorandum of understanding with the Roanan Corporation
to move the terminal to Hyder Alaska.
Ref 63 Business wire
Ref 64 Syncrude
Wikipedia
Ref 65 Reuters
Ref 66 Mc Dermot
Ref 67 Hydrocarbonprecessing
Ref 68 Gazprom
Ref 69 UK Oil
Ref 70 Reuters
Ref 71 Platts
Ref 72 oilprice.com
Ref 73 coking.com
Ref 74 Oil and gas technology
Ref 75 Google
Ref 76 ceic data
Ref 77 neb-one.gc.ca
Further data about the Auterra oils are shown in picture 61 below the references
Wikipedia
The
delayed coker unit, part of a $1 billion investment announced in 2014, will
enable the 320,000 barrel per day (bpd) refinery to upgrade high-sulphur fuel
into various types of diesel, including the variant mandated by new laws
governing shipping fuels. [reut.rs/2jrMVPS
-
Spain's Puertollano refinery is undergoing a major turnaround from the end of
January. As part of the maintenance work on the conversion units, Repsol will
carry out work on the thermal insulation of one of the vacuum unit's (55,000
b/d) furnaces, as well as modifying some of the equipment in place at the head
of crude distillation unit No. 2. The work also includes the FCC (38,900 b/d)
and the coker (24,000 b/d). The turnaround should be concluded around March 20.
The company previously said it expected the work to conclude at the end of
March.
-
Poland's Plock refinery is planned to carry out works in the spring involving a
CDU, FCC (28,000 b/d), reformer (44,300 b/d) and one HDS (hydrodesulfurization)
unit.
Tupras
said the CDU unit in its Izmir refinery will be offline for the first 11-13
weeks of 2018, according to a presentation given in a teleconference. The CDU
was offline for part of the fourth quarter of 2017. Tupras said the revamp of
the Izmir refinery Plt 7000 crude oil unit was responsible for crude oil
capacity utilization falling from 107.5% in Q3 to 89.7% in Q4, w
--
Italian refiner Saras has wide-ranging maintenance plans for the first half of
this year, it said in its fourth-quarter report, with work due to be carried
out on CDU units T1, T2 and RT2, vacuum distillation unit V2, the visbreaker
and mild hydrocracking unit 2. In the first quarter of
Swedish
refiner Preem AB reported lower throughput in the fourth quarter of 2017
following maintenance at its
Gothenburg
refinery adding that more maintenance was to come in the first quarter. The
company said that in early March it decided to move maintenance work on
selected units, mainly the isocracker unit and fluid catalytic cracker, planned
for April to March. It did not specify where this work would be but traders
said maintenance is affecting the Lysekil refinery near Brofjorden, where there
is also CDU and VDU maintenance in Q1. "These maintenance activities are
progressing well, and the plan is to have the units back in operation with
products to tank from the isocracker on March 18, and products to tank from the
FCC on March 22," Preem said.
-
Gazprom Neft has started construction of a delayed coker at its Pancevo
refinery, with a target date for completion of 2019. The delayed coker will
have 2,000 mt/day capacity and will help increase the depth of processing to
99.2% and diesel production by more than 38%. The refinery will start producing
coke, currently not produced in Serbia.
- Swiss
commodity trader Gunvor is looking at various options for its refinery in
Rotterdam aimed at meeting the International Maritime Organization's
requirements for low sulfur marine fuel from 2020, the company said, adding
that it hasn't made any decision yet. Late last year, the Dutch authorities
said that, in response to a Gunvor inquiry, it had clarified that there was no
need for an environmental assessment for a delayed coker. But a Gunvor
spokesman said the company has not made a decision regarding upgrade wo
Total
Completes $1.2B Upgrade At Its Biggest Refinery In Europe
By
Tsvetana Paraskova - Nov 30, 2017, 3:00 PM CST
France’s oil supermajor Total SA said on
Thursday that it had completed the upgrade of its Antwerp refinery, its largest
refining and petrochemicals platform in Europe,
The new
refining complex will reduce the high-sulfur heavy fuel oil yield, in
anticipation of the new marine fuel regulation that will take effect in 2020,”
Total said.
Another
oil supermajor with a facility at Antwerp in Belgium, ExxonMobil, said earlier
this week that it planned to complete the construction of the new delayed coker
unit towards early 2018 and would then proceed with the start-up process. The
delayed coker unit will be fully operational in the first half of 2018.
2018
will be a big year for Delayed Coker projects.
ExxonMobil
will complete it’s DCU in Antwerp in early 2018.
The
LOTOS Gdansk delayed coker cokes on line in 2018 as part of their Effective
Refining Project. Read More
Construction
has started on the Delayed Coker at Serbia’s Pancevo Refinery.
INA is
tendering bids for a DCU in Rijeka, Croatia.
Read More
PEMEX
has plans for a $2.1 billion delayed coker project.
Lukoil
has decided on a Delayed Coker at Nizhny Novgorod Refinery. Read More
Because
of MARPOL VI, resid conversion flexibility is needed b
The
coking unit will be installed at the Campana Refinery in Buenos Aires Province,
Argentina. It will be based on Foster Wheeler’s proprietary SYDEC delayed
coking technology. SYDEC is a thermal conversion process to upgrade heavy
residue feed and process it into high-value transport fuel
Crude
oil imports grew to 759 Mb/d in 2016, a 1% increase. The U.S. share of these
imports, which had been growing consistently for several years, decreased from
63% to 54%. Canada's main sources for overseas imports in 2016 were Saudi
Arabia (11%), Algeria (11%), Nigeria (10%), and Norway (6%).Mar
Canada’s
Oil Consumption was reported at 2,343.25 Barrel/Day th in Dec 2016. This
records an increase from the previous number of 2,298.82 Barrel/Day th for Dec
2015. Canada’s Oil Consumption data is updated yearly, averaging 1,800.31
Barrel/Day th from Dec 1965 to 2016, with 52 observations. The data reached an
all-time high of 2,382.87 Barrel/Day th in 2013 and a record low of 1,108.12
Barrel/Day th in 1965. Canada’s Oil Consumption data remains active status in
CEIC and is reported by BP PLC. The data is categorized under World Trend
Plus’s Association: Oil and Gas Sector – Table RO.BP.OIL: Oil: Consumption.
ARCHIVED
- Estimated Production of Canadian Crude Oil and Equivalent
4212602
bpd in 2017
4490351
bpd 2018 forecast
While neatbit railways are safer and not much more
expensive than pipelines (pictures 53 and 54), that only applies to
transporting to upgraders or complete refineries that can process it, The PS of
23 May 2018 shows why Kinder Morgan has no chance to reach the Asian market
with dilbit. The same applies to the G7G railway which therefore has been
planning to use newly developed Auterra oils. They are light oils with less
than 1% sulphur, close to syncrude but at a much lower cost. While China has
little capacity to process dilbit they import and refine a lot of oil heavier
than the Brent or WTI trading benchmarks. In fact, they recently established
their own Shanghai standard against which heavier oils will be rated and
traded. Picture 57 shows how Chinese crude imports have grown from 6 million
bpd in 2012 to 8.5 million bpd in 2017. Despite increased protests about our
exports the world demand is still rising for at least 7 years and will level
off for many more years. We may as well go along with the trend rather than letting
others create the same quantity of GHG that people are complaining about. When
we keep extracting at a soon to be reached 5 million bpd there is lots of
export opportunity for blended heavy oils. I will prepare a further PS with
picture to document the new developments about the competition. Some
politicians and oil magazines still claim that we can make much more money by
selling to Asia rather than the US. It is
not as much as they think but still worthwhile.
PS 3 and picture 61 in post 31 shows that
Chinese crude blends will be in high demand for quite some time and that by
transporting them with the G7G railway to Valdez will cost $ 5 less per barrel than
with small tankers from Burnaby to Valdez from where the oil has to be
transferred to larger, more economical tankers. This PS and picture 62 show with
many references why our main crude, WCS is worth far less than what is traded
based on Brent and WTI qualities. Chinese
refineries have no extra capacity for dilbit but high demand for heavy oil.
This PS also has a lot of information about competitiveness and widely varying
shipping costs. The $5 per barrel in savings has been increased to $6.20
because the amazingly high tanker cost is based on Anacortes to San Francisco
rather than Anacortes to Los Angeles. That $ 4.00 is clearly shown on the Dec 2015 Oil
Sands Magazine map. That map shows the cost of 14 US pipeline, tanker and
railway transportation modes from Edmonton and Fort Mc Murray. There are no
pipelines to the West coast but 5 pipeline and 3 railway options to reach the
Southern refineries. Picture 60 only shows the 3 cheapest pipeline routes which
are $7.51, 8.38 and 11.40 per barrel. Our WCS oil costs $ 15 for upgrading to
WTI standard so with those transportation rates the present price difference of
$24 is not out of line.
The demand for
Chinese crude blends is according to https://www.platts.com/latest-news/oil/singapore/cnpc-forecasts-chinese-2018-oil-demand-to-grow-27906041
growing 7.7 % in 2018. Even though fossil fuel for cars will soon be
banned, the GDP will increase 6% while oil product exports are forecast to
surge 30.7% year on year.
According to a 1
June article in the Globe and mail “Continued investment in the oil sands
generally, and in the Trans Mountain pipeline specifically, means Canada is
doubling down on a no-win bet. We’re betting that the world will fail to meet
the reduction targets in the Paris Climate Agreement, thus needing more and
more oil, including our expensive and polluting bitumen. We’re betting, in
other words, on climate disaster. If, however, the world finally gets its act
together and significantly cuts emissions, then Canada will lose much of its
investment in the oil sands and the Trans Mountain pipeline expansion, because
the first oil to be cut will be higher-cost oil such as ours”.
Looking at both sides you will see in post 29
and picture 32 that we should not increase oil extraction beyond present
levels. That will eliminate the 30 Mtpa for expansion but we can’t stop our
present production. Oil companies would go bankrupt while other countries would
use their oil to create the same amount of GHG. According to https://www.neb-one.gc.ca/nrg/sttstc/crdlndptrlmprdct/stt/stmtdprdctn-eng.html our production will soon reach 4.6 million
bpd and there is no reason to increase it. https://www.ceicdata.com/en/indicator/canada/oil-consumption Indicates
that our consumption is about 2.4 million bpd, which leaves 2.2 million bpd for
export. When the BC carbon tax was introduced consumption dropped 17%. With the
coming national tax, we can expect at least a 10% drop which bring the exports
to 2.4 million bpd
Tanker traffic to
and from the Burnaby refineries is limited to the dept and bridge clearance of
our port. According to https://www.portvancouver.com/about-us/.../petroleum-products-and-tanker-safety/ the
largest tanker the port can accommodate has a capacity of 120,000 tonnes. At 6.92 barrels/ton that is a capacity of 830
000 barrels. The tankers can’t be fully loaded. https://ca.reuters.com/article/businessNews/idCAKBN13G016 reports that “the largest-sized oil tanker that can dock
in Vancouver is an Aframax, which can carry 500,000 to 700,000 barrels. Vessels
at the port can only be loaded up to 80 percent capacity due to depth and other
restrictions, meaning a vessel can only be filled to around 550,000 barrels.
That’s a stark contrast to the one million-barrel Suezmaxes, or the two million
barrel very large crude carriers (VLCCs) commonly found in Iraq or Singapore.”
Valdez and LOOP in Louisiana are the only US ports that can utilize VLCCs. https://www.bloomberg.com/.../giant-oil-tankers-from-u-s-seen-cutting-time-money-a.. . reports that
transferring crude costs $0.20 per barrel
The big advantage of using Valdes as a
shipping point for Canadian blends to China can be seen in a January 2016
report: https://www.reuters.com/article/us-usa-crude-asia/traders-eye-alaskan-oil-exports-to-asia-as-shipping-ban-ended-idUSKBN0UM0FM20160108 reported that Oman
crude, a Middle Eastern grade similar in quality to Alaska North Slope (ANS),
delivered to North Asia on a Very Large Crude Carrier would cost about $30.60 a
barrel, including freight. Meanwhile, ANS costs closer to $31.80 a barrel
including $3 per barrel in freight costs on a Suezmax tanker, according to
calculations by Reuters and trade sources.
Alaska North
Slope has been at roughly a $3 to $4 per barrel discount to the similar Russian
ESPO blend so far this month. Freight costs from the Russian port of Kozmino to
South Korea are currently about 80 cents per barrel.
Even so,
medium-sour Alaskan crude fits well with most Asian refineries that are geared
towards processing high-sulfur Middle East crude, dealers say, and shipping
time is half the four-week journey from the Gulf. Present spot rates for VLCCs can
be seen in https://www.hellenicshippingnews.com/more-scrapping-may-lift-oil-tanker-rates-in-late-2018-frontline-ceo/ “Spot rates for very large crude carriers (VLCCs), with
a capacity to transport 260,000 tonnes of oil, have recently dropped to a
loss-making $13,000-14,000 per day, far below Frontline’s cash breakeven rate
of $21,600”. Since 1 tonne is about 6.9 barrels it amounts to 1,794,000 barrels
for $21,600 per day=1.2c per barrel per day.
When operating at the quoted loss it will be 0.75c per barrel per day.
For the two-week journey the $21,600 amounts to 16.8 c/barrel to reach Asia
from Valdez. There must be some more cost than $21,600 because the 16.8 c is
unbelievable low.
The 550 000 barrel limitation for the Burnaby tankers
makes their transport very costly. It
costs $ 4 per bitumen barrel from Anacortes to San Francisco. That can be seen
on the map in the Dec 2015 Oil Sands Magazine. Via the branch TM line to
Anacortes it costs $2.76/Bbl from Edmonton bringing the total to $ 6.76,
compared to $14 per train. That saves them $7 per bitumen barrel. Since Long Beach
Cal also has no pipeline access, Alberta dilbit will gain even more by tanker
to those refineries. The railway cost is
$17 per barrel. The $7 savings may soon disappear because the TMX may double the transport cost from Edmonton to Anacortes while railway cost to SF could drop $ 4 per barrel https://dogwoodbc.ca/newblended heas
&/kinder-morgan-delivering-oil-california/Indicates with markings that a lot of TM dilbit
goes to Long Beach near los Angeles. If Alberta decided to export a heavy crude
blend to China like is already been done by US rail via Portland Oregon I would
cost a lot more than can be achieved with the proposed G7G railway. I tried to
find marine distances but https://www.aquaplot.com/privacy and
https://www.sea-seek.com/tools/tools.php required signing for free membership but I could not find
the apps. My best measurements are 1600 km from Vancouver to San
Francisco and 2400 km from Vancouver to Valdez. That brings the cost to Valdes
to $ 6.00 per bitumen barrel. Add 20c to transfer to a large tanker and the G7G
railway savings over blended crude from Alberta via Burnaby will be $6.20 per barrel
but could be less if only the largest allowable tankers are used
https://oilprice.com/oil-price-charts shows the June 7
& 8 2018 futures market prices as follows: WCS sold
for $40.95, WTI $65.74 and Brent $76.46 That $ 24 difference between Alberta’s
heavy sour and North America’s light sweet is easy to understand. Upgrading at
Southern refineries costs $ 15 and transporting dilbit to the refineries can
cost up to $20. The 11 Canadian blends ranged from $51.95 to $65.95. The 47
US oils traded at $49.99-$69.53 . These
are the blends which we have to watch carefully. http://business.financialpost.com/commodities/energy/canadian-crude-is-finding-a-new-way-to-asia-without-a-pipeline reports that Alberta crude has been
exported to China via rail to Portland Oregon. That shows that we can be
competitive. Previously crude oil arriving by train at the Columbia River was sent
by tanker to Puget Sound. That most have been dilbit. See https://1bps6437gg8c169i0y1drtgz-wpengine.netdna-ssl.com/wp-content/uploads/2017/legacy/Tar_Sands_Report.pdf
I have not been able to find prices on the
Shanghai Futures Exchange (ShFE). but it may be a help for Canada. I also don’t
know if there is still that much difference as reported by Dogwood 2 years ago:
“In 2016, Asian refineries paid even less than U.S. refineries for comparable
blends of heavy crude – as much as eight dollars less per barrel.” I. The price
difference between our oil and that of the US is well expressed in http://www.oilsandsmagazine.com/news/2015/12/26/how-much-for-that-heavy-oil which states: “Shipping crude oil from
Mexico or the Middle-East to the US by tanker is only a few dollars a barrel.
Shipping oil from Alberta to the Gulf Coast by rail or pipeline ranges from $10
to $20/bbl”.
A lot has been written about the ShFE https://www.brookings.edu/blog/order-from-chaos/2018/04/19/chinas-currency-displacing-the-dollar-in-global-oil-trade-dont-count-on-it/On March 26 2018, China launched crude oil
futures contracts priced in renminbi (RMB) on the Shanghai International Energy
Exchange. These contracts are the first RMB-denominated futures that foreigners
can directly buy and sell. https://www.reuters.com/article/us-china-oil-futures-explainer/china-aims-to-challenge-brent-wti-oil-with-crude-futures-launch-idUSKBN1GY0S9 States: “The launch of China’s yuan-denominated oil
futures will mark the culmination of a decade-long push by the Shanghai Futures Exchange (ShFE) aimed at giving the
world’s largest energy consumer more power in pricing crude sold to Asia”.
Replacing the US dollar gives some problems as noted by https://www.brookings.edu/blog/order-from-chaos/2018/04/19/chinas-currency-displacing-the-dollar-in-global-oil-trade-dont-count-on-it/“China will need to liberalize its financial
markets and its capital account. In practice this means allowing foreigners to
easily buy Chinese stocks and bonds and to move money in and out of the country
as needed. Given the large debt overhang
that has developed in China, opening its capital account quickly would in fact
be risky”. “An additional challenge to RMB as a trading currency for oil is
that several important oil and gas producers in the Middle East have currencies
pegged to the U.S. dollar, including Saudi Arabia, the United Arab Emirates,
Oman, and Qatar. Kuwait’s currency is pegged to a basket of currencies
dominated by the dollar. These pegs came about to provide stability to oil-producing
countries when the United States was the world’s largest oil importer. Recent
low oil prices challenged the pegs, as economic growth in the United States led
to gradually increasing interest rates at the same time that oil revenues for
the oil-producing countries were declining, arguing for lower interest rates in
those countries. Despite this challenge, the pegs held and rising oil prices
have improved fiscal conditions in the producing countries”
The export of
dilbit to the US via the TM pipeline has gone on for quite some time and the
people in the Anacortes area are quite upset about the dangers involved. As
reported in http://vancouversun.com/news/local-news/washington-state-officials-very-concerned-canadas-oil-pipeline-spill-plan-lacking
“Canada’s
approval of Kinder Morgan’s Trans Mountain pipeline is raising concerns with
Washington State officials, who say they have not received adequate assurances
that U.S. waters will be protected in the event of an oil tanker spill.” “I think quite frankly this is a Canadian oil industry
project and to think that they can buy the social licence of Canadians by
putting U.S. waters at greater risk is wholly irresponsible and will be
vehemently fought,”
shows that
Whatcom County has imposed a temporary moratorium on all projects that will
increase the Puget Sound tanker traffic. https://earther.com/canadian-oil-pipeline-could-drive-famous-puget-sound-wh-1826860189
notes that there
is a chance the local Orca whale population will become extinct by adding 360
tanker exits per year. compared to the present 40. These Orcas feed in the same
channels and eat less with so much extra sound.
Meantime it is
clear that the twinning will help exporting to the 5 refineries in the
Anacortes Ferndale area. http://www.oilsandsmagazine.com/news/2016/3/03/why-vancouver-desperately-needs-a-new-oil-refinery reports that following closing of BC
refineries we now import 70% of our gasoline and 60% of our jet fuel from the
Puget Sound area in Washington. That is where most of the TMX oil will go. The
Puget Sound line, which branches from the Trans Mountain line before Burnaby
can carry at the moment 240,000 bpd which is 80% of the present TM volume. According
to http://www.sightline.org/2017/06/05/an-oil-pipeline-expansion-in-washington/“The Puget Sound pipeline is capable of
being expanded to increase its capacity to approximately 500,000 bpd from its
current capacity of 240,000 bpd.” Twinning will bring the total capacity to 890,000
bpd. If 500,000 goes to Puget Sound and 50, 000 is refined at Burnaby while
according to www.timescolonist.com/.../key-facts-about-the-trans-mountain-pipeline-expansion-1.2
15% ( 45,000
bpd} is delivered as refined products, 295,000 bpd will still be exported to
California apart from the 400 tankers per year from Puget sound
Further data about the Auterra oils are shown in picture 61 below the references


Picture 29 has been updated to reflect transport of heavy
crude blends rather than neatbit (pictures 60-62) The original Mid Canada Corridor
was a concept developed by Canadian Major-General Richard Rohmer. It would create
an East West belt, well away from the US with a railway at its spine. Rohmer
convened a conference of 150 business, political leaders and advocates to
discuss how the North would be developed A large Engineering company provided
many maps and reports on the technical aspect, mining and forest resource locations,
soil conditions, climate aspects and significance for First Nations. When
Rohmer presented the final report to prime minister Pierre Trudeau at Rideau
Hall in 1971, it was refused virtually on the spot. The meeting continued, with
Trudeau responding to Rohmer’s arguments with indifference. Leaving Rideau Hall
to go to question period, Trudeau was still “testy and agitated”.
In 2017 the Senate submitted a new version of the
Corridor which includes a link to the Arctic. This time a new PM, Justin Trudeau
reacted completely different than his father. He endorsed the report, clearing
it for adaptation. Picture 63 shows some aspects of the new report but here are
some quotes from a 25 October article in the Yukon News to show how important
the MCC was to those who studied it:
Great national efforts left their mark the late 1960s,
and for decorated Canadian Major-General Richard Rohmer,
the changing atmosphere of the 1960s was just what was needed for his expanding
plan to move the country North.
“The development corridor, as it is envisioned, is a belt
that traverses Canada through its mid-North and northern regions, with a
railway as its spine,” read a 1967 introductory pamphlet.
“Within this belt will grow new towns, new industries,
new highways, enlarged ocean ports, new agricultural areas and a new
transportation grid for the whole of Canada,” it said.
In 1969, Rohmer convened a
conference of 150
business, political leaders and advocates to discuss how the North would be developed,
what needed to be done, and the imperative of doing it soon.
As it planned the future, the conference was determined
to “avoid the mistakes of the past — the degradation and exploitation of the
true native Canadian peoples, wanton pollution of air and water and
indiscriminate destruction of the only pure, virtually untouched region on this
continent,” wrote Rohmer in 1970.
In a country where First Nations had only received the
vote nine years previously, the conference was remarkable for its close
involvement and consultation with First Nations peoples. “If we, the white men,
who are so impatient to get out the wealth and tame the area, cannot devise
ways to involve our native brethren, then we had better stay away until we
can,” said a conference participant.
Not shown in the Yukon News is that Acres, a large
engineering company did 2 years of work, preparing maps of mining, forestry and
First Nations interest. Also maps about climate, soil conditions and proximity
to existing railheads. They also prepared a lengthy complementary report. To no
avail
The optimism of the conference fell on deaf ears in
Ottawa only months later. When Rohmer presented the
final report to prime minister Pierre Trudeau at Rideau Hall in 1971, it was
refused virtually on the spot.
“I think that he thought at the time that I was a
Conservative, and that anything we were doing was not worth looking at,” said
Rohmer. The meeting continued, with Trudeau responding
to Rohmer’s arguments with indifference.
Leaving Rideau
Hall to go to question period, Trudeau was still “testy and agitated,”
wrote Rohmer.

Y
The carbon tax problems
So many environmental problems can be solved with a
global revenue neutral carbon tax. It would allow people and businesses to
decide how to spend their refunds on green projects and make above average
gains. Via a carbon export tax an
international fund could pay for CCU and green hydrogen power on a per tonne
basis. The costs of wind and solar power are already about equal to fossil fuel
but, as shown in picture
21 J, CCU is essential. Picture 25 K shows 4 different modern carbon capture
plants. Picture 33 M gives an excellent example of CO2
utilization. Picture 49 P
shows how much can be achieved with green hydrogen.
I started reading and recording articles from the US
Carbon Tax Center and saw in 2013 that the US had a number of carbon pricing
bills. I only looked closer at the Waxman Markey bill, designed to meet the
Copenhagen commitment and the Sanders Boxer bill, which is a carbon tax bill.
At the same time the BC had its revenue neutral bill. Both the Waxman Markey
and the BC bill were contested by powerful organizations, producing completely
wrong figures how it would affect families by leaving out all the refunds. It
is all detailed in post 1 and we still live with the problem. Post 3 shows how
much export tax BC could raise when we don’t export our carbon for free. Post 9
reports the losses endured by the European rejection of the Northern Gateway.
It was not only about the lack of carbon tax but also the unfair subsidies.
When in London, Mr Harper was met by 40 protests groups while 6 MPs signed
motions to keep Alberta oil put of Europe. Post 10 stresses again that without taxing,
demand for oil will keep rising. We don’t have to cut our production and give
our share to others creating the same amount of GHG but hope for a global
decline. Post 12 shows that 3 major oil companies demand a global carbon tax because
with their vast natural gas reserves they can kill the coal industry. The
second part analyses a speech, which the Canadian MP, Mr. Leef gave in the
house, showing that he has no idea how a revenue neutral carbon tax works and
that there are no MPs which can give him the correct figures on the spot. Post
19 and points F), G) and H in post 27 again show all the advantages of taxing
carbon via a revenue neutral system. Points 1-7 in post 30 show how close the
US can come to a global tax. Their proposed $40 tax forces countries with a
lesser tax to pay import duties. China is a main target. Since all money raised
will go to citizens, they shut out industries because those already will
receive tax cuts. It is clear that illegal immigrants don’t get any refund. Of
the 11 million illegal people 8 million work. That is 5% of the total labor
force. So, it is not revenue neutral but raises the standard of living of
working people.

While the BC carbon tax was revenue neutral and used as
an example by other countries, dangerous flaws have occurred. I have often
tweeted picture 37
in reply to tweets from others. Just recently one tweeter referred to a Globe
and Mail article (61) showing that pre-existing subsidies like those to the
film industry and interactive digital media had been sneaked in as carbon tax
refunds. Worse yet, the present provincial budget appears to scrap the law that
all tax collected has to be refunded to businesses and individuals who paid for
it. A few days later I got from another tweeter the Financial Post article (62)
with a similar stora including figures and a graph to show how bad it is.
Please, let’s tell the government to restore our original system.
When Mr. Trudeau agreed in Paris to start taxing carbon
he should in the national interest have made it a national revenue neutral
carbon tax. By leaving it to the provinces we are faced with a hodgepodge of
cap and trade, specific environmental projects and an array of subsidies for
items like cars or solar panels, which are not necessarily what individuals want
to spend their refunds on. We hope that it will result in prevention of
excessive global warming.
References
1
2
3
4
https://thinkprogress.org/how-the-epa-and-new-york-times-are-getting-methane-all-wrong-eba3397ce9e5/
5
http://onlinelibrary.wiley.com/doi/10.1002/lno.10307/full
6
businesstimesafrica.net/.../239-these-new-cow-fart-packs-from-argentina-could-save-t...
7
8
9
10
11
https://www.theatlantic.com/science/archive/2017/06/methane-burps/528654/
12
13
14
15
16
17
18
19
20
21
22
23
24
25
26
27
28
29
30
31
32
33
34
35
36
37
38
39
40
41
42
43
44
45
46
47
48
49
50
51
52
53
54
55
56
57
58
59
60
61
62
63
64
65
66
67
68
69
70
71
72
73
74
75
76
77
78
PS
March 22 2018
Since I published
post 31 I added 5 more pictures with references. They don’t need any further explanation.
Here they are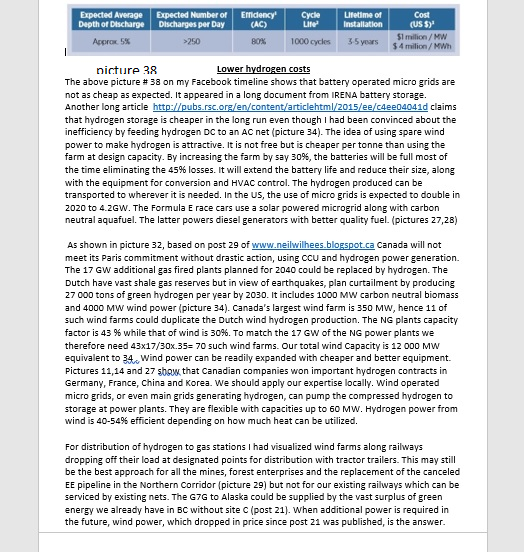


Mình đã tìm thấy các thông tin cần thiết ở đây, cảm ơn bạn. Mình cũng muốn giới thiệu về một Công ty dịch thuật uy tín - Công ty cổ phần dịch thuật miền trung - MIDtrans có văn phòng chính tại địa chỉ 02 Hoàng Diệu, TP Đồng Hới, tỉnh Quảng Bình có Giấy phép kinh doanh số 3101023866 cấp ngày 9/12/2016 là đơn vị chuyên cung cấp dịch vụ dịch thuật, phiên dịch dành các cá nhân. Hệ thống thương hiệu và các Công ty dịch thuật con trực thuộc: công ty dịch thuật tphcm - dịch thuật sài gòn 247 , địa chỉ 47 Điện Biên Phủ, Phường Đakao, Quận 1 TP HCM, dịch thuật phan thiết, bình thuận : địa chỉ 100 , Lê lợi, TX Phan Thiết là nhà cung ứng dịch vụ dịch thuật uy tín hàng đầu tại Bình Thuận vietnamese translate : dịch vụ dịch thuật cho người nước ngoài có nhu cầu, giao diện tiếng Anh dễ sử dụng; dịch thuật công chứng quận 12 (mười hai) : nhà cung ứng dịch vụ dịch vụ dịch thuật phiên dịch hàng đầu tại Quận 12 (mười hai), TP HCM; dịch thuật đà nẵng midtrans : Địa chỉ 54 Đinh Tiên Hoàng, Quận Hải Châu, TP Đà Nẵng chuyên cung cấp dịch vụ dịch thuật công chứng, dịch thuật chuyên ngành tại Đà Nẵng; dịch thuật hà nội midtrans : địa chỉ 101 Láng Hạ, Đống Đa, Hà Nội là nhà cung ứng dịch vụ biên dịch, phiên dịch chuyên nghiệp tại địa bàn Hà Nội. Chúng tôi chuyên cung cấp các dịch vụ biên dịch và phiên dịch, dịch thuật công chứng chất lượng cao hơn 50 ngôn ngữ khác nhau như tiếng Anh, Nhật, Hàn, Trung, Pháp, Đức, Nga, Tây Ban Nha, Bồ Đào Nha, Ý, Ba Lan, Phần Lan, Thái Lan, Hà Lan, Rumani, Lào, Campuchia, Philippin, Indonesia, La Tinh, Thụy Điển, Malaysia, Thổ Nhĩ Kỳ..vv... Dịch thuật MIDtrans tự hào với đội ngũ lãnh đạo với niềm đam mê, khát khao vươn tầm cao trong lĩnh vực dịch thuật, đội ngũ nhân sự cống hiến và luôn sẵn sàng cháy hết mình. Chúng tôi phục vụ từ sự tậm tâm và cố gắng từ trái tim những người dịch giả.Tự hào là công ty cung cấp dịch thuật chuyên ngành hàng đầu với các đối tác lớn tại Việt nam trong các chuyên ngành hẹp như: y dược (bao gồm bệnh lý), xây dựng (kiến trúc), hóa chất, thủy nhiệt điện, ngân hàng, tài chính, kế toán. Các dự án đã triển khai của Công ty dịch thuật chuyên nghiệp MIDtrans đều được Khách hàng đánh giá cao và đạt được sự tín nhiệm về chất lượng biên phiên dịch đặc biệt đối với dịch hồ sơ thầu , dịch thuật tài liệu tài chính ngân hàng, dịch thuật tài liệu y khoa đa ngữ chuyên sâu. Đó là kết quả của một hệ thống quản lý chất lượng dịch thuật chuyên nghiệp, những tâm huyết và kinh nghiệm biên phiên dịch nhiều năm của đội ngũ dịch giả của chúng tôi. Hotline: 0947688883. email: info@dichthuatmientrung.com.vn . Các bạn ghé thăm site ủng hộ nhé. Cám ơn nhiều
ReplyDelete